Using the ADAPL Debugger: stepping through code

Contents
As soon as a relevant action starts an adapl which was compiled in debug mode, the ADAPL Debugger opens. The Locate missing adapl file window will open on top of it. Search for the .ada file from which the currenctly executed ADAPL .bin file was compiled and click Open. So if, for example, the docustor.bin file is now being executed, then locate the docustor.ada file from which it was compiled. This file will open in the ADAPL Debugger.
The execution of the code is paused at the first line; all comment lines and empty lines with which the adapl may begin, are skipped. In the image below you can observe this paused status for docustor.ada: processing has paused at line 46. This line is marked in red.
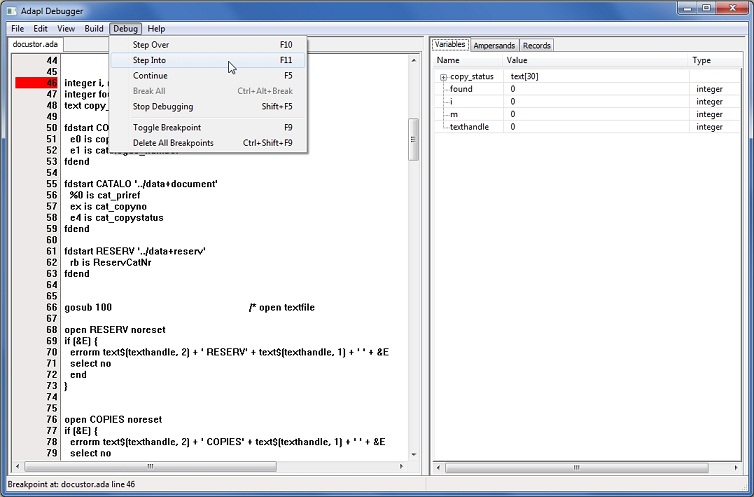
To proceed to the next line of code, choose Step into in the Debug menu (see the image) or press F11. You can step through the whole adapl this way, until it ends, if you wish.
If you are sure that certain blocks of code are okay, then you can run through them unseen by using breakpoints and/or stepping over subrountines. This means that whatever way of stepping through the code you choose, all code will still be executed normally in between steps, but the debugger just won't pause at every line:
| • | If the current line is a gosub statement, like line 66 in the example above, then pressing F10 (Debug > Step over) will execute the subroutine normally but the debugger won't pause at any line of code inside that subroutine: it will only pause at the line after the gosub statement, line 67 in the example. You should only use F10 if you are sure that there are no errors in the subroutine, because if there is a bug in there you won't know at which line in the subroutine something went wrong. |
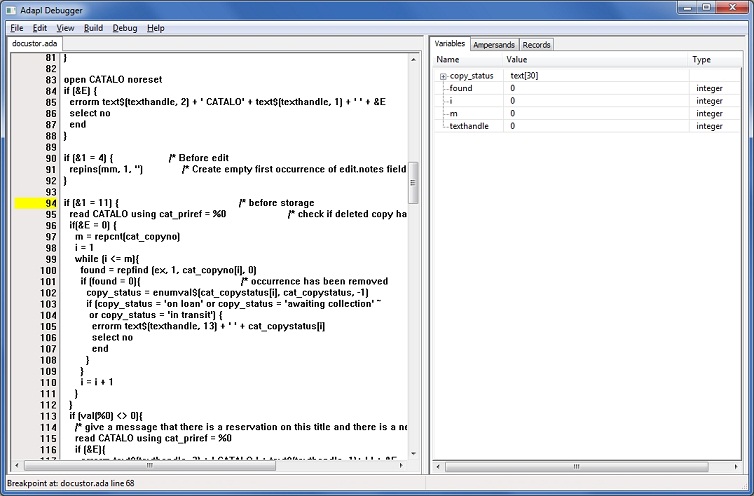
| • | If you have a good idea where the bug might be located, and you don't want to step into or over a lot of code manually, you will want to use breakpoints. Just click on the line on which you want to pause the execution of the adapl and press F9 (Debug > Toggle breakpoint). The line will be marked yellow to indicate a breakpoint (see the image below). If the currently active line (marked in red) still comes before the breakpoint, then pressing F5 (Debug > Continue) will further execute the adapl unseen right up to the breakpoint. Typically, you would use F11 and F10 next, to execute the problematic piece of code line by line, to be able to observe exactly where things go wrong. A breakpoint can be deleted by selecting it and pressing F9 again. Note that you are allowed to use multiple breakpoints. Pressing Ctrl+Shift+F9 will delete all breakpoints at once. |
| • | When you've seen enough, and just want to process the adapl up to the end statement, and finish its execution, just press F5 one or more times. The ADAPL Debugger window will be minimized, ready to continue debugging, for instance if the adapl must be executed again - some adapls may be executed several times in a row if the adapl handles different types of events, like an after-field event, an after-screen event and a before-storage event. |
| • | Instead of pressing F5 several times, to execute an adapl all the way, you may choose to stop debugging for now, by pressing Shift+F5. The adapl will be executed normally, while the ADAPL Debugger window is minimized. No further debugging will take place at all until you explicitly start debugging again by pressing F5 while the (still active) ADAPL debugger has the focus. (Use Alt+Tab or the Windows taskbar to put the ADAPL Debugger in focus again.) File > Exit will close the ADAPL debugger entirely, after which it can only open again after restarting your Adlib application. |
| • | The currently executed adapl is displayed on the active tab in the ADAPL Debugger. This tab has the name of the adapl. If an adapl employs an include file for code shared with other adapls, the included file (also ADAPL code) will open on its own tab as soon as code in it is executed. This typically happens after a gosub statement, since include files contain subroutines. Besides include files, completely different adapls may be opened in the ADAPL Debugger as well, if they have been compiled in debug mode and are currently executed too. This situation may for example occur when the adapl you are trying to debug currently writes record data into some FACS database, while a storage adapl has been linked to that database. During the writing of the data, the control is then handed over to the storage adapl, and only after that is finished will the control be handed back to the "main" adapl. Of course, if the storage adapl hasn't been compiled in debug mode, you won't even notice that it is being executed. Note that include files never need to be compiled separately, they are included in the compilation of the adapl which refers to the include file. So when stepping through adapl code, the active tab may switch automatically or a new tab is added where execution will continue temporarily. |